
Guides / Model accuracy
Which weather model is the most accurate?
No weather model is the most accurate at everything. Accuracy depends on what you measure (temperature, rain amount, storm track), how far ahead you look, where you are and which season it is, so the model that leads one test can trail in the next. The reliable approach is to compare models at the same valid time, check how many ensemble members agree, and look at how each model has done near you.
By Weather Decision Solutions. Published . Updated .
How forecast accuracy is measured
Verification means comparing what a model said with what happened. The comparison can be against weather station observations or against an analysis, which is a best estimate of the real atmosphere built from many measurements. Whichever one is used, the result is a score, and every score answers a narrow question.
Forecast centers publish scores for exactly that reason. ECMWF, for example, tracks headline scores for upper-air patterns, ensemble temperature, precipitation and tropical cyclone position, and several of them are reported as the lead time at which skill falls to a set level. NCEP publishes its own verification for the GFS, and the WMO Lead Centre for Deterministic NWP Verification collects scores so different centers can be compared on consistent terms.
| Score | What it asks | Where it is used |
|---|---|---|
| Bias | Does the model run warm or cold, wet or dry on average? | Temperature, precipitation, wind |
| Mean absolute error or RMSE | How far off is a typical forecast, in degrees, inches or knots? | Temperature, wind, pressure |
| Anomaly correlation | Does the model get the large-scale pattern right, such as ridges and troughs at 500 mb? | Upper-air height maps |
| Precipitation scores such as SEEPS | Did it put rain or snow in the right place and amount category? | Precipitation |
| Track error | How far was the predicted center of a storm from where it went? | Tropical cyclones and other storms |
| CRPS and other ensemble scores | Was the whole range of ensemble members well calibrated, not just the average? | Ensembles |
Five things that change the ranking
| What changes | Why it matters | Example |
|---|---|---|
| Lead time | Errors grow with time, and models grow errors at different rates. | A short-range model can be best at 12 hours and unavailable at day 5. |
| Variable | A model can be good at pressure patterns and weaker at rain amounts. | Temperature and precipitation are scored separately. |
| Region | Mountains, coasts and lakes challenge models differently. | A score for the whole country can hide a bad region. |
| Season | Winter storms and summer thunderstorms test different parts of a model. | A model that handles a coastal low well may struggle with pop-up storms. |
| Weather situation | Calm patterns are easy for everyone. Fast-changing setups separate models. | A stalled front and a developing nor’easter are different tests. |
This is why a single headline such as "the best model" does not hold up. It answers one version of the question, in one place, in one season. Change the question and the order can change.
Why no single model wins everything
The atmosphere is chaotic. Small errors in the starting state and the approximations inside every model grow with time, which is why ECMWF says no forecast system can be perfect. Different models make different approximations, so they miss in different ways.
- Global models such as GFS and the ECMWF IFS cover the whole planet and run out 10 to 16 days. They carry the large-scale pattern.
- Convection-allowing models such as HRRR use a 3 km grid to show individual storms, but they only run a day or two ahead.
- AI models learn from decades of past weather. When NOAA launched its AI-GFS in December 2025, it reported better skill than the GFS for many large-scale features and better tropical cyclone tracks, while intensity forecasts needed improvement, which a July 2026 upgrade set out to address. A model that is strong on the big pattern is not automatically strong on a local rain total.
- Blends such as the National Blend of Models combine many inputs and calibrate the result. Even so, NOAA changed how the current version computes wind and gusts to address a low bias at higher speeds in the medium and extended ranges, a reminder that a blend has weak spots too.
Even for tropical cyclones, the National Hurricane Center says its official forecasts have, on average, smaller errors than any individual model, because forecasters weigh all of the guidance. Looking at many sources is how forecasters get better answers than any one source gives.
How ensembles and blends help
An ensemble runs the same model many times from slightly different starting points. NOAA’s Weather Prediction Center notes that the high-resolution control run is the best member only about 5 to 7 percent of the time, and that the GFS ensemble mean began to beat the single operational GFS run for 500 mb heights at about day 3.5. The spread among members is also a measure of confidence: tight spread means higher predictability, wide spread means the forecast is still open.
Blends and multi-model averages work for a related reason. Errors that point in different directions partly cancel. The cost is that an average smooths away a sharp feature that only some members show, so a blend is a strong starting point and not a final answer. Our ensembles guide shows how to read the spread.
How to judge the models yourself in 4070
You do not have to take anyone’s ranking on faith, including ours. 4070 Pro has four tools built for this:
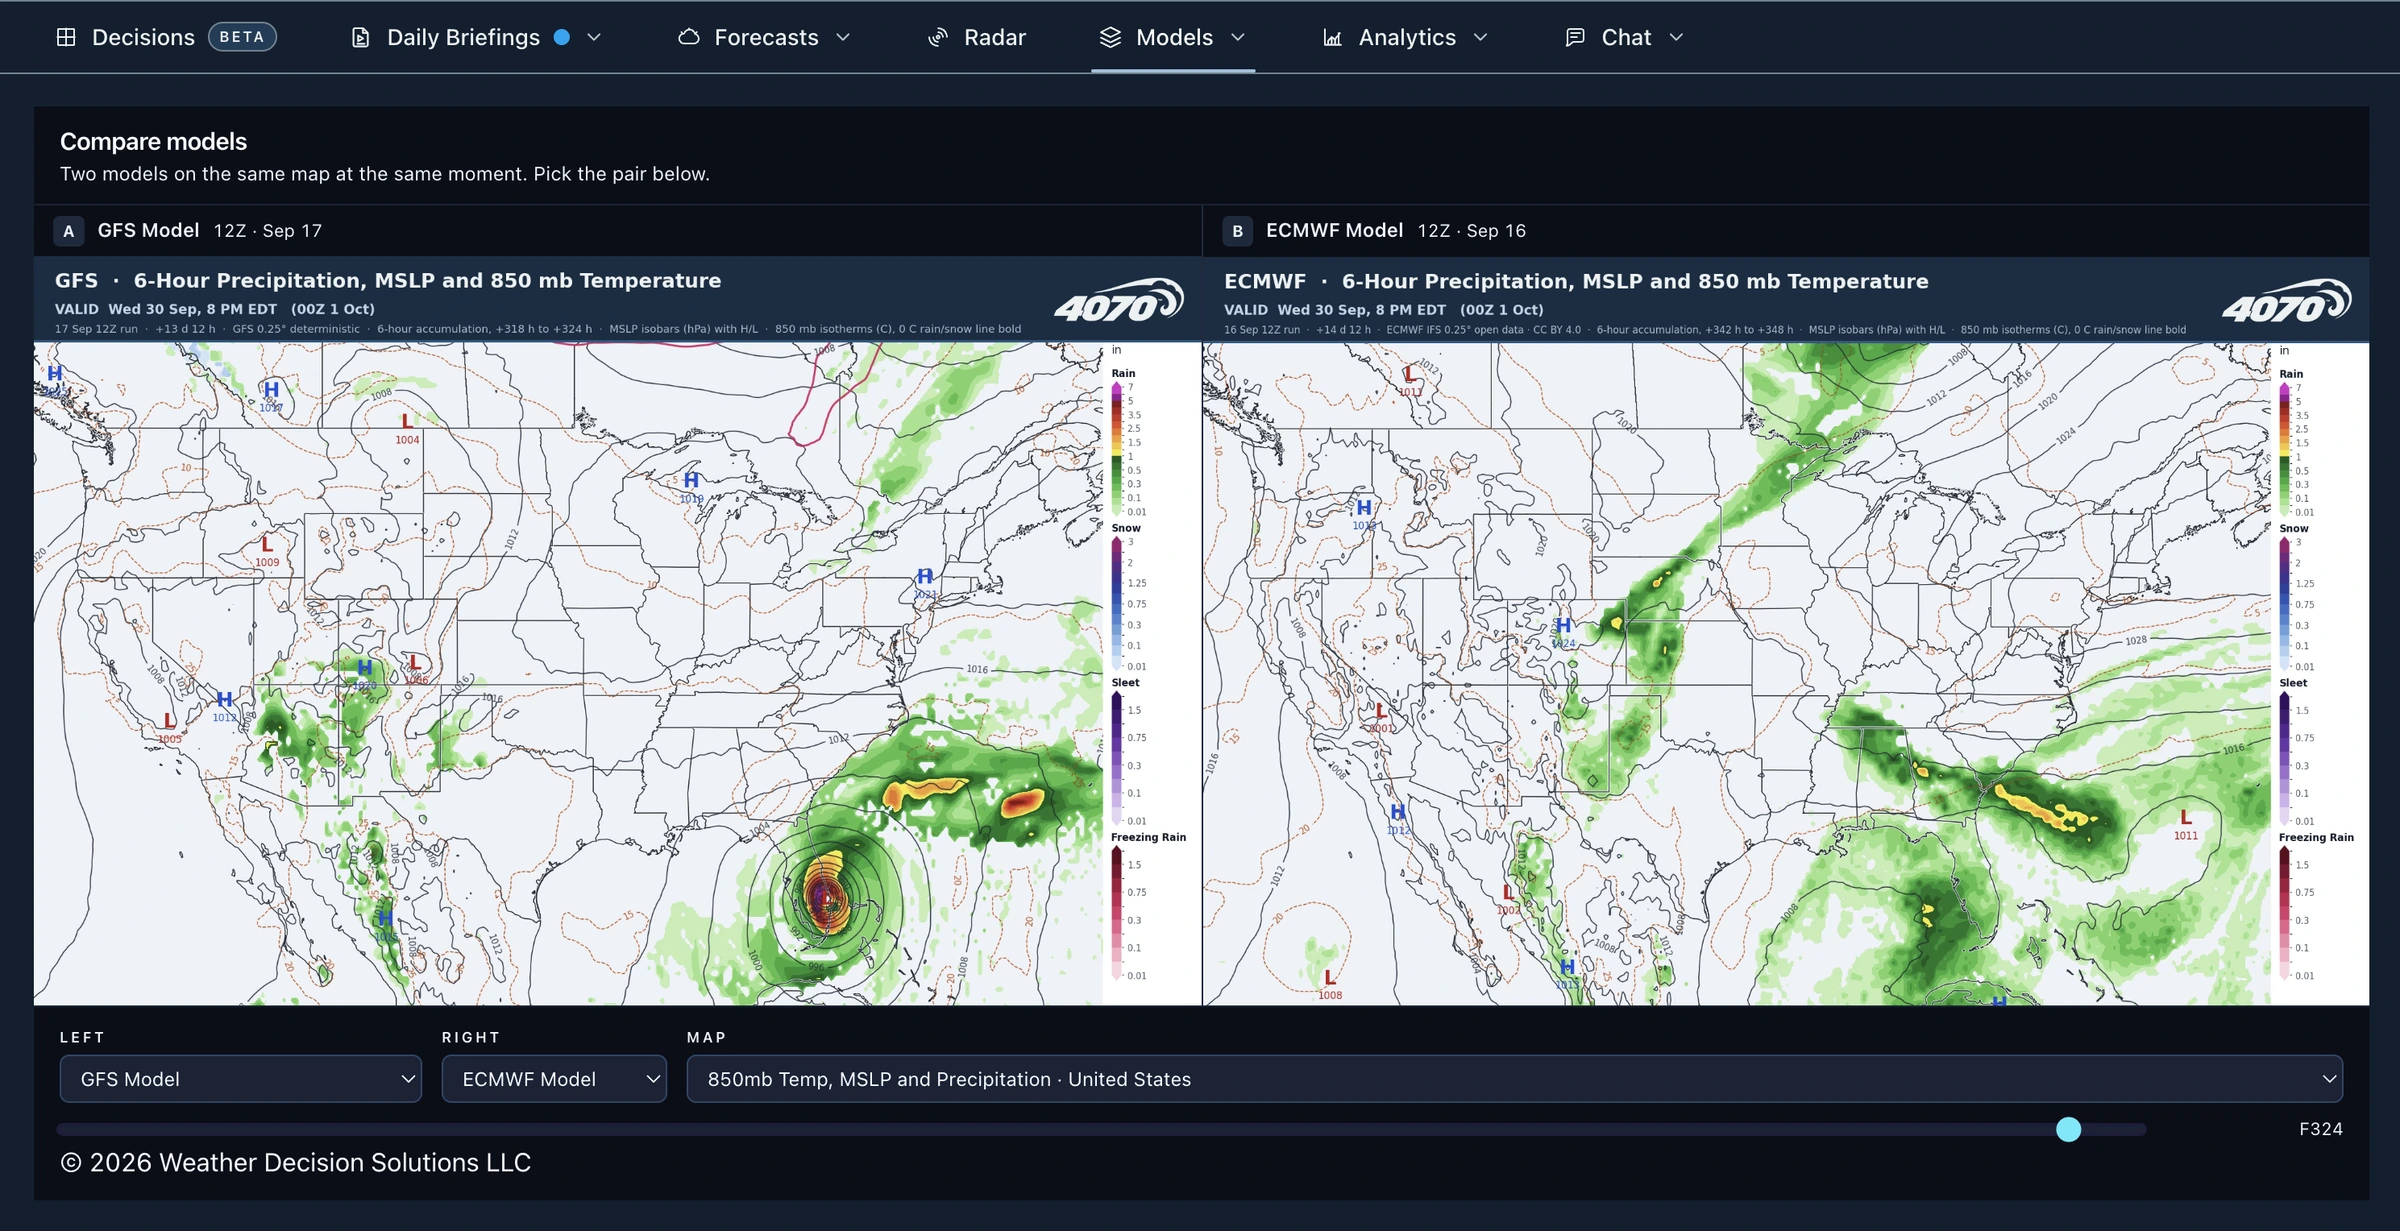
- Compare Models puts two compatible models on the same map at the same valid time, so you are comparing the same moment and not two different hours. Each side names its own run.
- Compare Cycles wipes between an earlier and a newer run of one model at the same valid time. A model that keeps changing its mind from run to run deserves less trust.
- Plumes show every ensemble member at a U.S. point, so you can tell whether an eye-catching total has company.
- Model Scorecard looks back over recent days at each of your saved locations and shows how the models compared with the weather station nearby, so you can see which ones have been closest where you live. The station can differ from conditions at your exact site, so treat it as a guide.
Summer 2026 check: average daily temperature forecast error
Daily high and low temperature forecasts verified against measured observations at 147 US stations, July 6 to October 3, 2026; every model scored on the same station-days (8,252 at one day ahead, 8,228 at three days). Error is the average miss in °F; lower is better.
| Model | One day ahead (°F) | Three days ahead (°F) |
|---|---|---|
| NBM | 2.54 | 2.95 |
| ECMWF AIFS | 2.78 | 3.01 |
| ECMWF IFS | 2.94 | 3.31 |
Precipitation errors were within about a hundredth of an inch of each other, effectively a tie. GFS is not shown because our archive stores it blended with short-range data, which would not be a fair comparison.
One summer is a small sample; rankings change by season, variable and region.
Five habits that beat picking a favorite
- Compare at the same valid time. A map from a different hour is a different forecast.
- Ask how many ensemble members support the run you are looking at. If the wild one is a lone outlier, treat it like one.
- Match the model to the job: a high-resolution model for the next few hours, a global model and ensemble for days 3 to 10.
- Watch the trend across runs, not one run. A track that keeps moving the same direction means more than one that bounces.
- Check how models have done near you before you lean on one. Local terrain and coastline can change the order.
Official National Weather Service forecasts, watches and warnings remain the authority for what is expected where you live. Model output is guidance behind them.
Common questions
What is the most accurate weather forecast model?
There is no single most accurate model. Accuracy depends on the variable, lead time, region and season being measured, so the leader changes from one test to the next. Compare several models and look at how many ensemble members agree.
Is the Euro better than the GFS?
It depends on what you measure and when. ECMWF and NOAA each publish verification for their own systems, and the order can differ by variable, lead time, region and season. In 4070, Compare Models shows both at the same valid time, and Model Scorecard in 4070 Pro shows how the models compared with the nearby weather station at each of your saved locations over recent days.
Are AI weather models more accurate?
Sometimes, for some things. At launch NOAA reported better skill than the GFS for many large-scale features and better tropical cyclone tracks from its AI-GFS, while intensity forecasts needed improvement. A model that gets the large-scale pattern right can still miss a local rain or snow total.
What is the best weather model for snow?
Snow depends on the storm track, the temperature through the air above you and the amount of precipitation, and different models are better at different pieces. Look at a high-resolution model for the next day or two, a global model and ensemble further out, and be careful with snowfall maps that assume a fixed 10 to 1 ratio.
How do forecasters measure whether a forecast was accurate?
They compare forecasts with observations or an analysis using scores such as bias, mean absolute error, anomaly correlation, precipitation scores and track error. Each score answers a narrow question, so a model can look strong on one and weaker on another.
Which weather model is best for hurricanes?
The National Hurricane Center says its official forecasts have, on average, smaller errors than any individual model because forecasters weigh all of the guidance. For tropical systems it helps to look at several models and the spread between them, and to keep the official forecast as the reference.
Can I see which model did best near me?
Yes, in 4070 Pro. Model Scorecard shows, for each of your saved locations, how the models compared with the nearby weather station over recent days, and Compare Models puts two models at the same valid time so you can judge them on your own weather.
Sources
- ECMWF, Quality of our forecasts. ECMWF headline scores are tied to a variable and a lead time, such as 500 hPa anomaly correlation, 850 hPa temperature CRPSS, precipitation SEEPS and tropical cyclone position error.
- WMO Lead Centre for Deterministic NWP Verification. Hosted by ECMWF; created in 2011 to give consistent verification information on the products of different forecast centers.
- NCEP EMC, GFS verification (grid-to-grid). NCEP publishes verification of GFS geopotential height, temperature, wind and pressure, including anomaly correlation. The page is not an operational product.
- NOAA WPC, Ensemble training. An ensemble is two or more forecasts verifying at the same time; the high-resolution control is the best member only about 5 to 7 percent of the time; the GFS ensemble mean began to beat the operational GFS for 500 mb heights at about day 3.5; a multi-model ensemble may verify better than one from a single model.
- ECMWF, Quantifying forecast uncertainty. Every forecast carries uncertainty from the starting state and from model approximations, both growing with time; ensembles estimate it.
- ECMWF, 30 years of ensemble forecasting. The atmosphere is chaotic, so no forecast system can be perfect; ensemble spread is a measure of predictability and forecast confidence.
- NOAA, New generation of AI-driven global weather models. A 16-day AIGFS run uses about 0.3 percent of the computing of a GFS run; NOAA reports better skill than GFS for many large-scale features and better tropical cyclone tracks, with intensity forecasts still needing improvement.
- NWS Service Change Notice 26-68, AIGFS v1.1. AIGFS v1.1 became operational July 27, 2026, with changes intended to improve tropical cyclone intensity and precipitation forecasts.
- NOAA MDL, National Blend of Models upgraded to version 5.0. NBM 5.0 was implemented May 5, 2026, adds the ECMWF and NOAA AI models as inputs, makes NDFD elements fully probabilistic on all domains except the oceans, and changes wind and gust calculations to address a low bias at higher speeds in the medium and extended ranges.
- NOAA NHC, Tropical cyclone guidance model summary. On average NHC official forecasts have smaller errors than any individual model, because forecasters weigh all of the guidance.
Check the models against each other.
Compare Models, Compare Cycles, Plumes and Model Scorecard are part of 4070 Pro. Start with seven days free, then $14.95 a month.