
Guides / Reading models
How to read weather models
A weather model map shows one simulated version of the atmosphere, started at a specific time (the run) and shown for a specific later moment (the valid time). To read it, find the run, the valid time and the forecast hour first, then look at the field, such as pressure, precipitation or temperature. Treat one run as one opinion, and check how many other runs and ensemble members agree.
By Weather Decision Solutions. Published . Updated .
Runs, initialization time, valid time and forecast hour
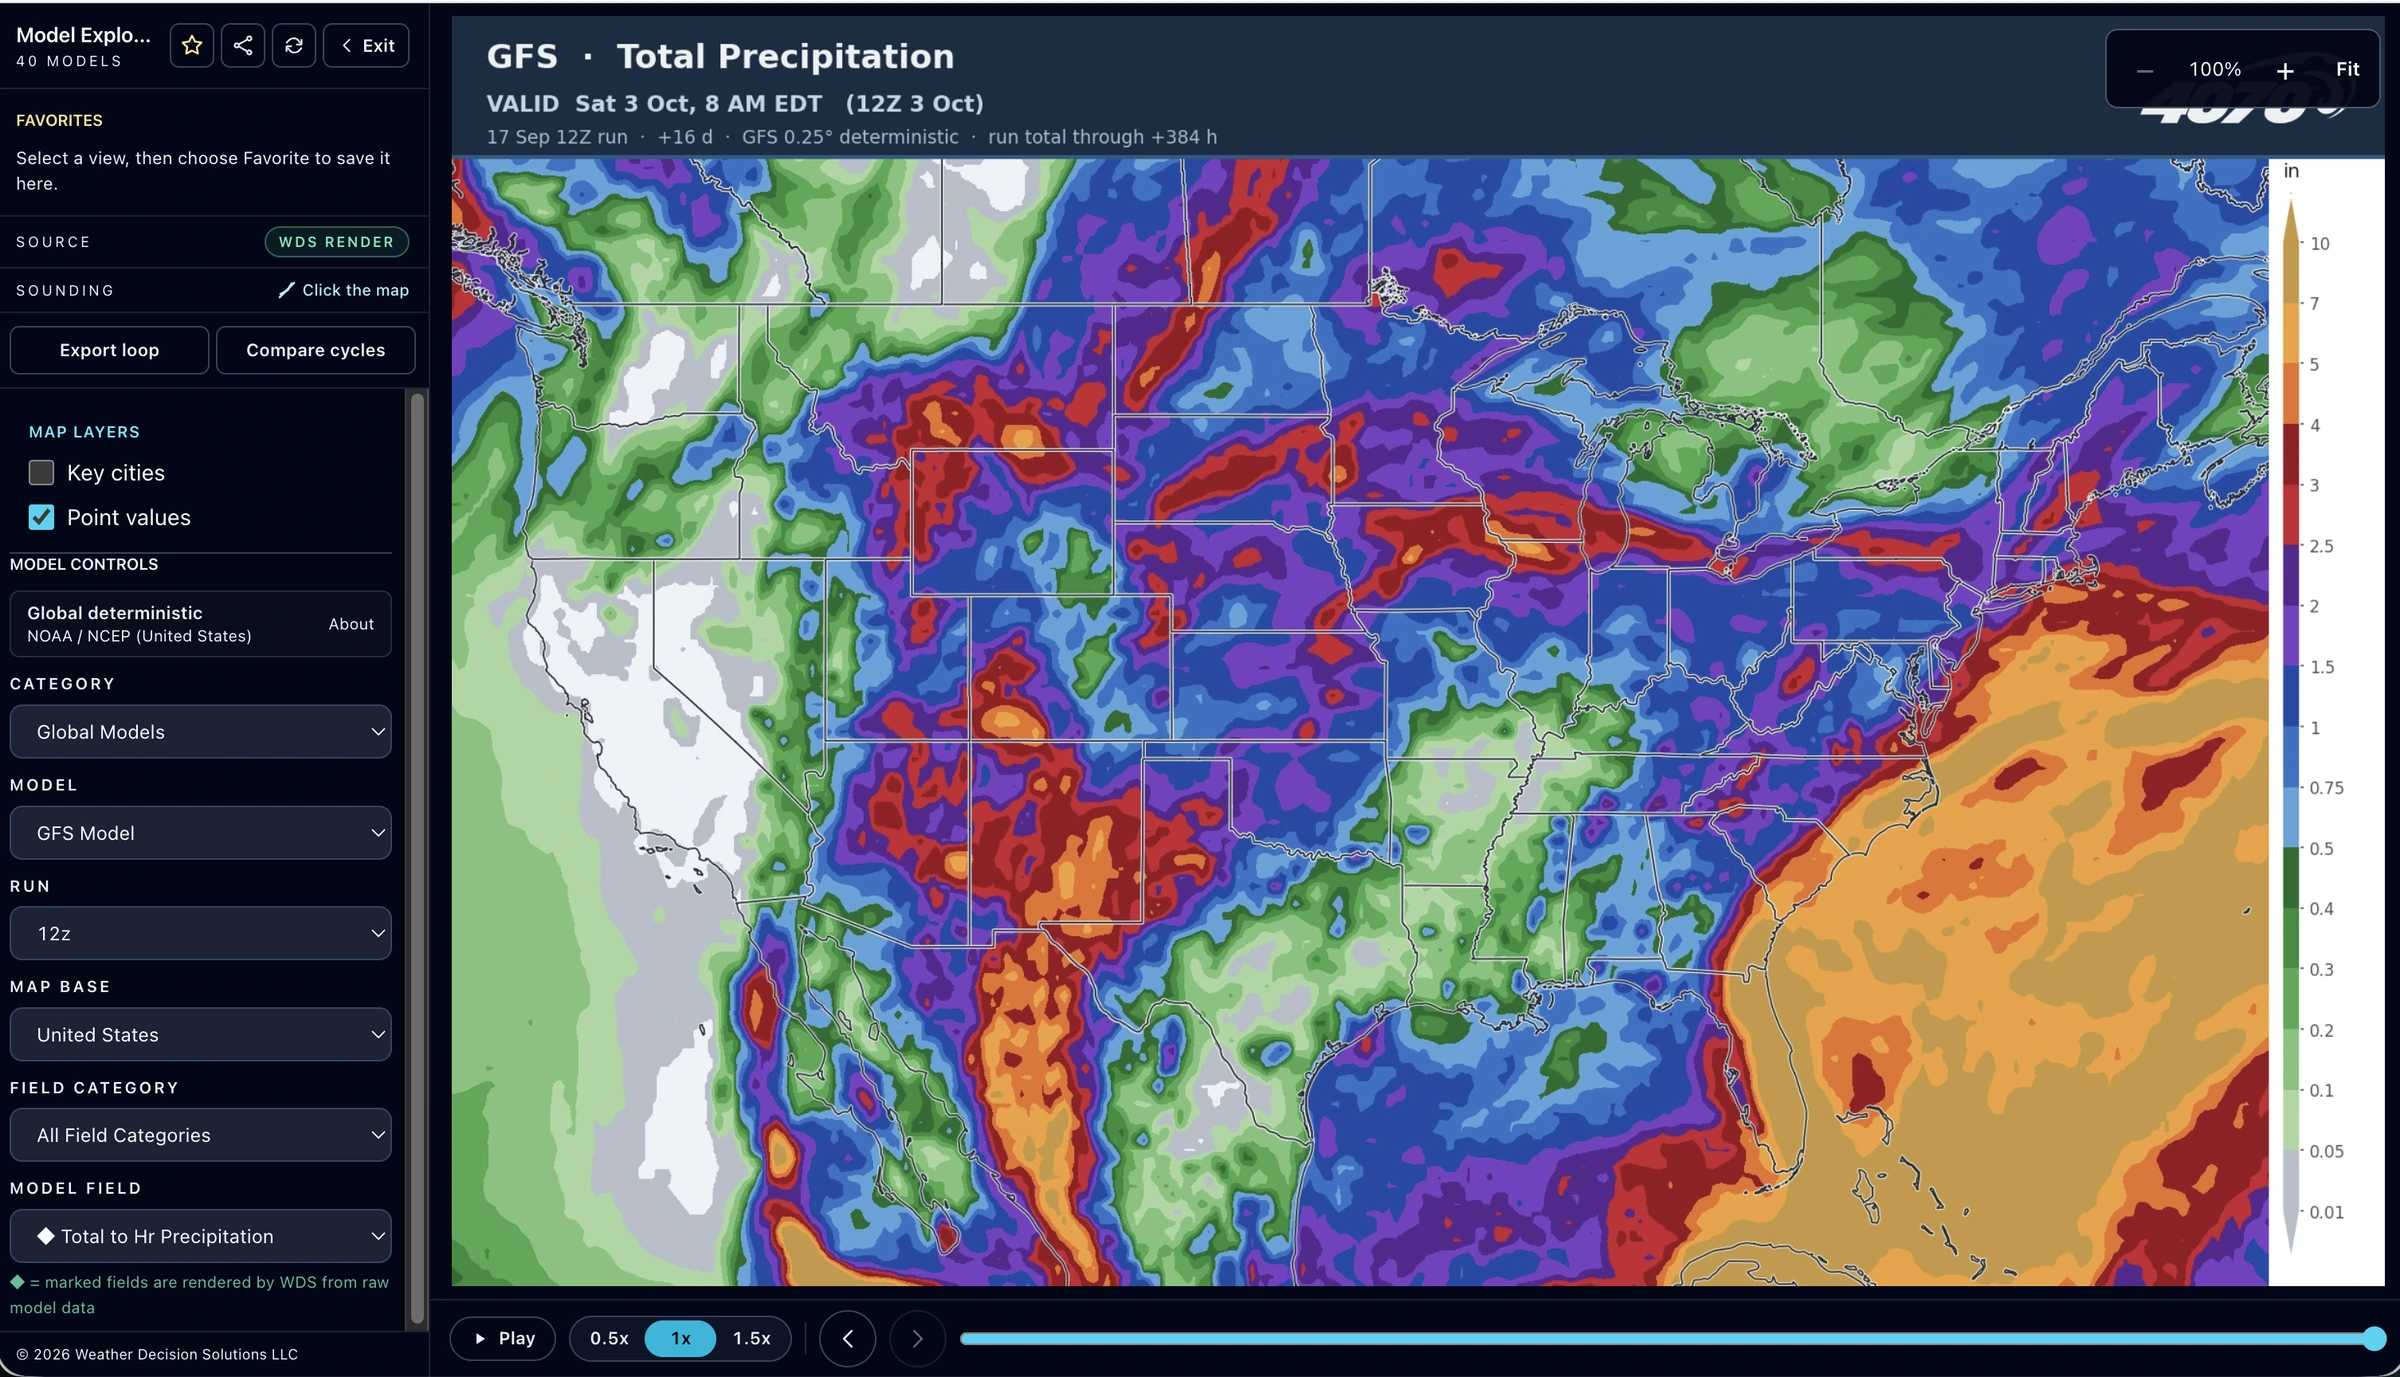
A model run starts from the best estimate of the current atmosphere, which is called the initialization. The model then steps forward in time and saves a map for each forecast hour. Four labels matter on every map, and mixing them up is the most common way to misread one.
| Label | Meaning | Example |
|---|---|---|
| Run (cycle) | When the model started, usually in UTC (Z) time. | 12Z run of September 17 |
| Forecast hour | How many hours after the run started. | +384 h, or 16 days |
| Valid time | The moment the map describes. It is the run time plus the forecast hour. | Saturday, October 3, 8 AM EDT |
| Field | What is being drawn. | Total precipitation |
Z time is UTC. During daylight time in the eastern United States, 12Z is 8 AM EDT, which is why the screenshot below shows "12Z 3 Oct" and "8 AM EDT" for the same moment. GFS runs four times a day (00Z, 06Z, 12Z and 18Z) out to 16 days, while HRRR starts a new run every hour but only looks ahead 18 to 48 hours. Different models refresh on different schedules, so "the latest run" is not the same time for every model.
Resolution: what a grid can and cannot show
A model divides the atmosphere into grid boxes. The GFS grid is about 13 km, while HRRR uses 3 km boxes. Smaller boxes can draw individual thunderstorms and snow bands. Larger boxes smooth them out but are cheaper to run for 16 days. A sharper map is not automatically a more correct one. A 3 km model can draw a very convincing storm in the wrong place.
Deterministic or ensemble
A deterministic model is one run. An ensemble is many runs of the same model from slightly different starting points, and NOAA’s Weather Prediction Center describes it as two or more forecasts verifying at the same time. If most members look like your map, the map has company. If it is the only member showing a blockbuster, you are looking at the wild run. Our ensembles guide goes through how to read the spread.
The fields you will see most
| Field | What it shows | How to use it |
|---|---|---|
| Mean sea level pressure (MSLP) | Pressure reduced to sea level, drawn as lines with H and L for highs and lows. | Find the storm center and its track. Tightly packed lines mean strong wind. |
| Precipitation (QPF) | Quantitative precipitation forecast: the liquid amount over a period, such as 6 hours. For snow this is the melted amount. | Judge how much falls and when. Check the accumulation period on the legend. |
| 2 m temperature | Air temperature about two meters above the ground. | Check highs, lows and the timing of cold air. |
| 850 mb temperature | Temperature about 5,000 feet up, drawn in degrees Celsius with the 0 C line often highlighted. | A first guide to whether precipitation near the ground is rain or snow. It does not replace a look at the layers below it. |
| 500 mb heights | The pattern of ridges and troughs in the middle of the atmosphere. | Shows what is steering storms. See our 500 mb guide. |
| Snowfall | Estimated new snow, usually liquid precipitation times an assumed ratio. | Read the next section before trusting the number. |
Why 10:1 snowfall maps overstate or understate
Many snowfall maps multiply the liquid amount by 10 to get inches of snow. That assumes 10 inches of snow for each inch of melted water. NWS La Crosse describes 10:1 as an old rule of thumb and points out that real ratios vary a great deal, even within one storm. Warm air near the ground, or layers near freezing, keep ratios down. Deep cold, with fluffy flakes, pushes them up.
- Near-freezing storms: a 10:1 map can overstate, because wet, heavy snow packs less depth per inch of water.
- Very cold storms: a 10:1 map can understate, because dry, light snow stacks higher.
- Mixed precipitation: a map that counts all precipitation as snow overstates, because sleet and rain add water without adding snow depth.
So read a snowfall map as a rough size of the storm, check the precipitation total and the temperature, and compare it with how many other runs show something similar. If a model shows 20 inches, ask how many members support that. Sometimes the answer is one, and then your 20 inches is a conversation starter and not a plan.
A reading checklist
- Find the model, the run and the valid time before you look at the colors.
- Check the forecast hour. Far out, treat the map as a pattern. Inside two days, details start to matter.
- Read the legend: units, accumulation period, and whether the number is liquid or snow.
- Look at the pressure pattern to find the storm and its track.
- Check temperature at the surface and at 850 mb, and ask where the rain-snow line sits.
- Compare with the previous run of the same model, and with another model at the same valid time.
- Check the ensemble. How many members support this run?
- Return to your location. A regional map is not an address forecast.
Where to practice in 4070
Model Explorer lets you choose a model, field, run and forecast hour, and keeps the valid time steady when you switch models. Compare Models shows two compatible models side by side at the same valid time, and Compare Cycles wipes between an earlier and a newer run of one model. Plumes show the ensemble spread at a U.S. point. All of these are part of 4070 Pro. Model pages such as GFS, ECMWF IFS and HRRR explain what each one is best at.
Official National Weather Service forecasts, watches and warnings remain the authority for what is expected where you live.
Common questions
How do I read weather models?
Start with the model, the run and the valid time, then read the field and its legend. Look at the pressure pattern for the storm track, compare with the previous run and another model at the same valid time, and check how many ensemble members agree.
What does 12Z mean on a weather model?
12Z is 12:00 UTC, the time a model run started. In the eastern United States during daylight time that is 8 AM EDT, and during standard time it is 7 AM EST. The run time and the valid time are different things.
What is the difference between run time and valid time?
The run time is when the model started. The valid time is the moment the map describes, which is the run time plus the forecast hour. A GFS map valid October 3 at 12Z from the September 17 12Z run is a 16-day forecast.
What does forecast hour mean?
It is the number of hours after the model run started. Forecast hour 24 is one day ahead and forecast hour 384 is 16 days ahead. Longer forecast hours carry more uncertainty.
Why do weather models change from run to run?
Each run starts from a slightly different estimate of the atmosphere, and small errors in the starting state and in the model itself grow with time. That is why forecasters watch the trend across several runs and not a single run.
Why do snowfall maps overstate or understate snow?
Many snowfall maps assume 10 inches of snow for each inch of liquid water. Real ratios vary widely, even within one storm. Near-freezing snow is wetter and packs less depth, so the map can overstate, while very cold snow is fluffier, so it can understate.
What is an ensemble in weather forecasting?
An ensemble is many runs of the same model from slightly different starting points. If most members agree, confidence is higher. If they disagree, the forecast is still open, and the spread shows how open.
What is the difference between GFS and ECMWF?
They are built and run by different agencies. GFS comes from NOAA and runs four times a day to 16 days. ECMWF IFS comes from the European Centre for Medium-Range Weather Forecasts and has a finer grid. Because they are built differently, they can place the same storm in different spots.
Sources
- NCEP EMC, Global Forecast System. GFS runs four times a day to 16 days at about 13 km with the FV3 core; GFSv16 was implemented March 22, 2021.
- NCEP Central Operations, HRRR. HRRR runs hourly on a 3 km grid, to 18 hours on standard cycles and 48 hours at 00, 06, 12 and 18Z.
- NOAA WPC, Ensemble training. An ensemble is two or more forecasts verifying at the same time; the high-resolution control is the best member only about 5 to 7 percent of the time; the GFS ensemble mean began to beat the operational GFS for 500 mb heights at about day 3.5; a multi-model ensemble may verify better than one from a single model.
- NOAA WPC, About the probabilistic QPF products. WPC quantitative precipitation forecasts are issued in 6-hour amounts for days 1 to 3, and the probabilistic product draws on an ensemble to show uncertainty.
- NWS La Crosse, Why snow ratios matter. 10:1 is an old rule of thumb; real snow-to-liquid ratios vary widely, even within one storm, with temperature, cloud makeup and wind among the reasons.
- NOAA WPC, Snow-to-liquid ratio training slide. Warm air near the ground or near-freezing layers keep ratios down; deep cold raises them.
- NWS Springfield, Winter weather forecasting checklist. Forecasters use 850 mb temperature and thickness as guides for snow, and the technique is only as good as the model output.
- ECMWF, Quantifying forecast uncertainty. Every forecast carries uncertainty from the starting state and from model approximations, both growing with time; ensembles estimate it.
- ECMWF, Changes to the ECMWF model. The history of IFS cycles, including cycle 50r1 on May 12, 2026.
Open a model and try it.
Model Explorer keeps the valid time steady while you switch models, fields and runs. It is part of 4070 Pro, with seven days free to try.