
Guides / Ensembles
Ensembles and spaghetti plots, explained
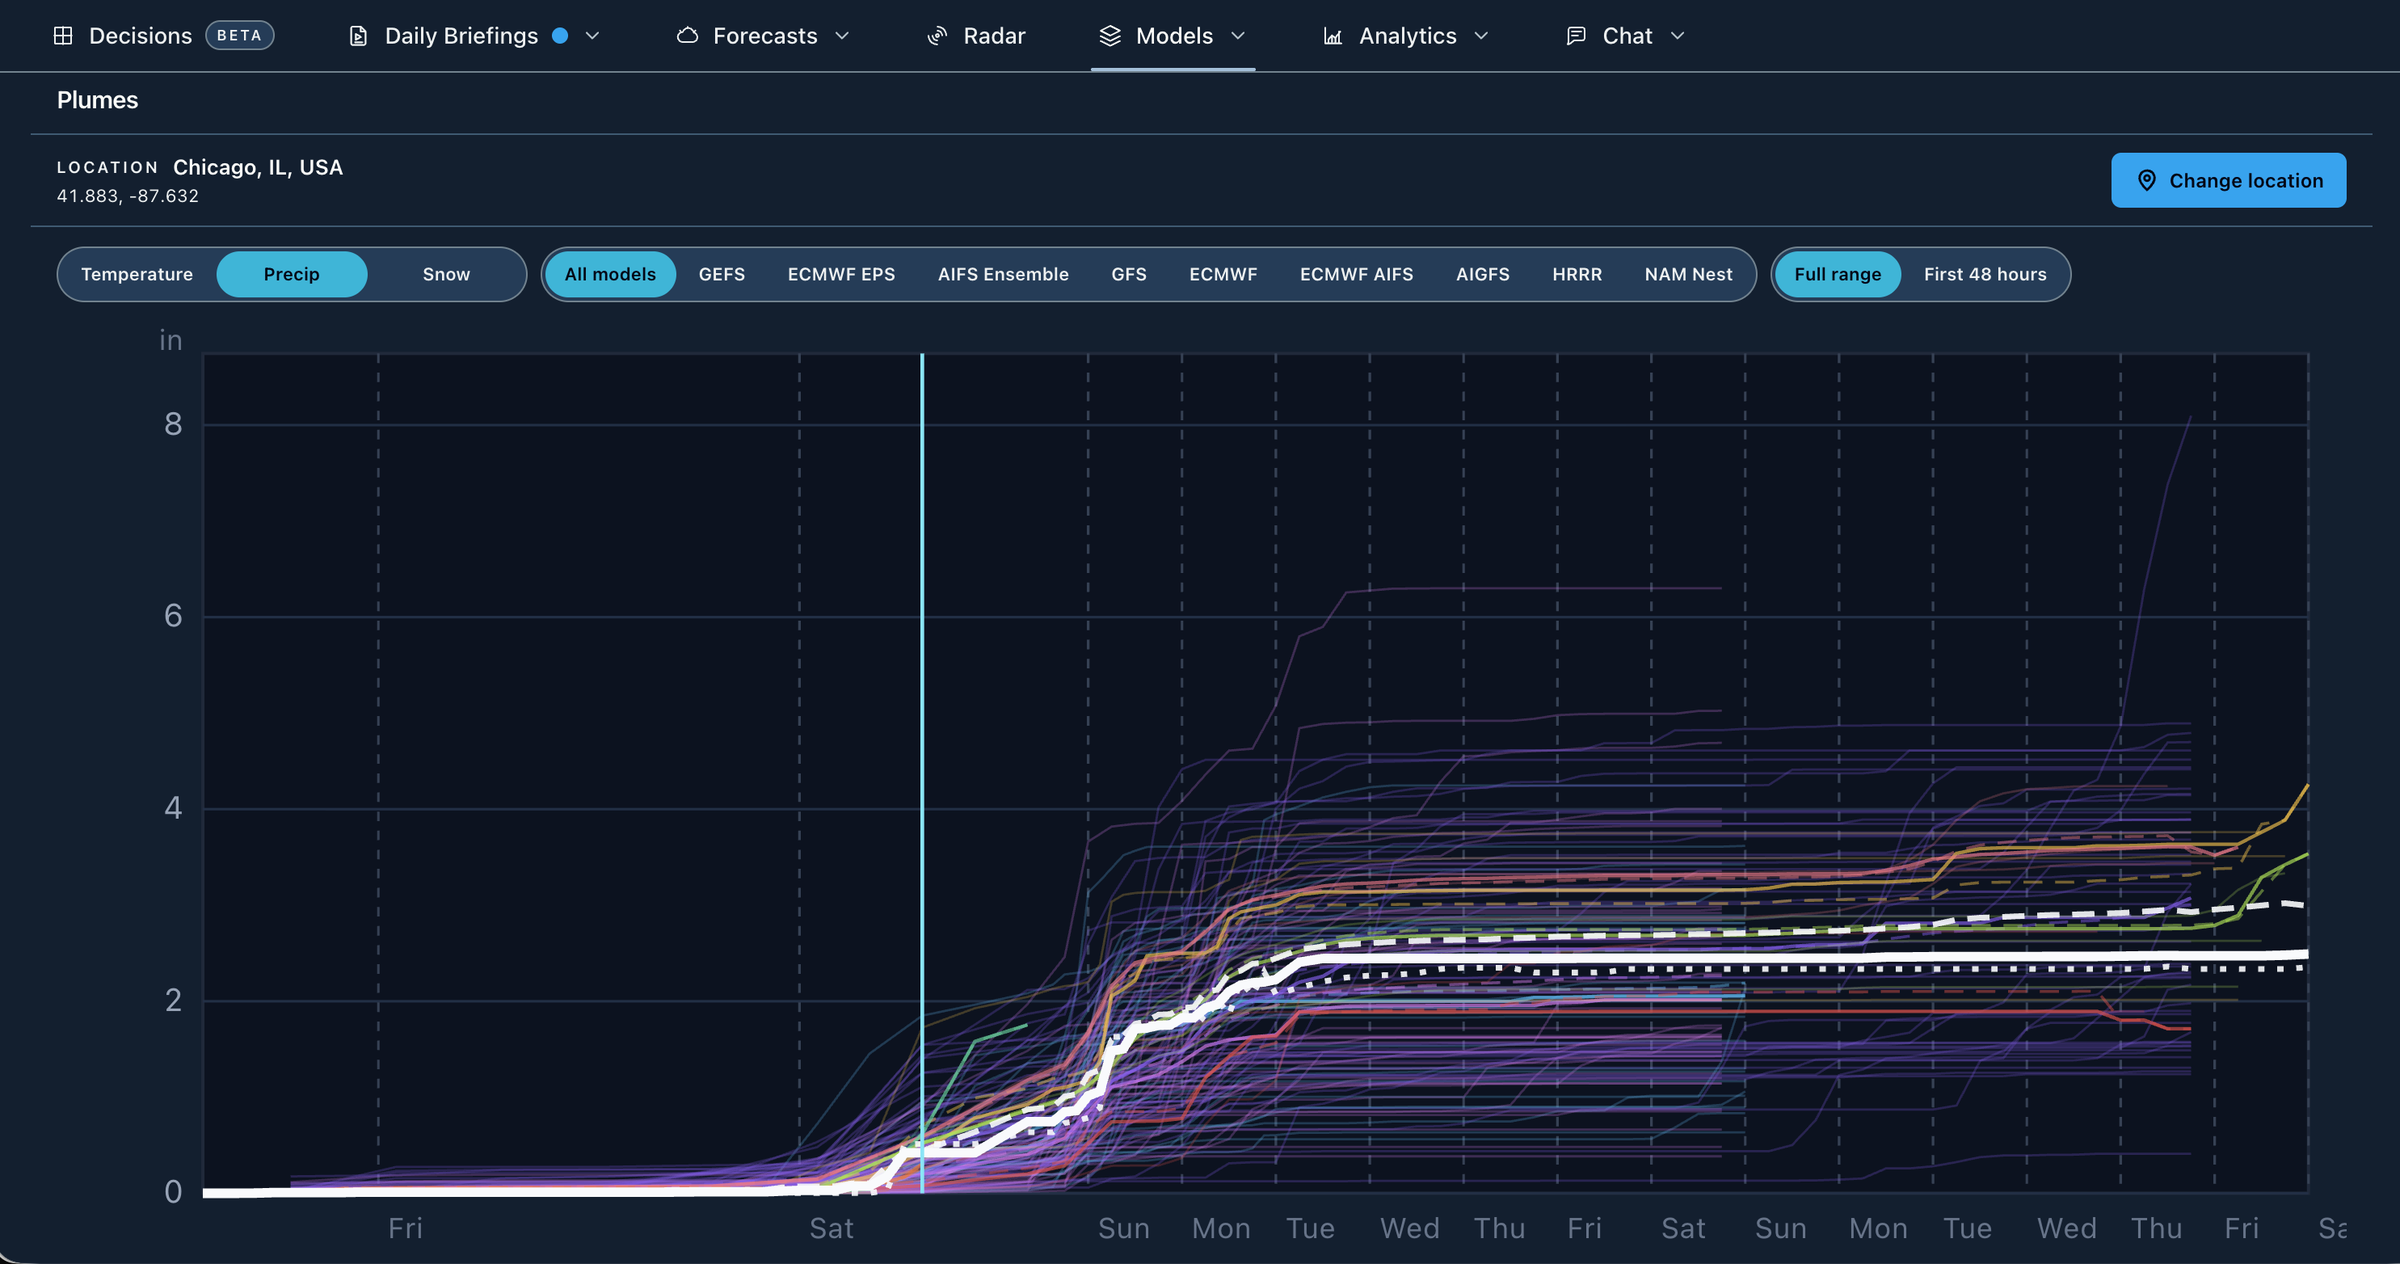
An ensemble is a set of forecasts from the same model, each started from slightly different conditions. A spaghetti plot draws every member’s result on one map, and a plume draws every member at one location over time. When the lines bunch together, confidence is higher. When they fan out, the forecast is still open, and the width of the fan shows how open.
By Weather Decision Solutions. Published . Updated .
What an ensemble is
Weather forecasting starts with an estimate of the current atmosphere, and that estimate is never perfect. ECMWF explains that errors in the starting state and approximations in the model both grow with time. Instead of pretending the starting point is exact, forecast centers run the model many times with small, deliberate changes to the start. Each run is called a member.
NOAA’s Weather Prediction Center puts it simply: an ensemble is two or more forecasts verifying at the same time. If the members stay close together, the atmosphere is in a setup where small errors do not matter much. If they split apart, small differences are growing fast, and the forecast is less certain. ECMWF describes ensemble spread as a measure of predictability and forecast confidence.
There are also multi-model ensembles, which combine members from different models. WPC notes that a multi-model ensemble may verify better than an ensemble from one model, and that the GFS ensemble mean began to beat the single operational GFS run for 500 mb heights at about day 3.5.
Four ways to look at an ensemble
| Display | What it shows | Best for |
|---|---|---|
| Ensemble mean | The average of all members. | A steady first look at the pattern. It smooths away features that only some members show. |
| Spread | How far apart the members are, drawn as a map. | Finding where confidence is high or low. |
| Spaghetti plot | One contour or track line per member on the same map. | Seeing whether a ridge, trough or storm track clusters or fans out. |
| Plume | Every member’s value over time at one location. | Seeing whether a big rain or snow total has company. |
NOAA’s Climate Prediction Center publishes spaghetti plots of ensemble members for days 3 to 7, with the ensemble mean drawn as a dashed line, and mean maps for later periods. The mean is the middle of the fan. The spaghetti shows the fan.
How to use spread to judge confidence
- Look for clusters. If most members bunch together, that is the main scenario.
- Look for two clusters. A split into two groups often means two different outcomes, such as a storm that either turns up the coast or goes out to sea. Plan for both until it resolves.
- Find the outliers. A single member far from the rest is possible, but it is a minority, not a forecast.
- Watch how spread changes between runs. Tightening spread over successive runs is a better sign than a single tight run.
- Remember that spread is not truth. A tight cluster can still be wrong if every member shares the same flaw.
This is the grown-up version of asking how many ensemble members support the wild run. If the answer is one out of fifty, the wild run is entertainment. If the answer is twenty out of fifty, it is a scenario.
Tropical storms
For hurricanes, the spaghetti plot is a plot of tracks, one line per member or per model. Two cautions help. First, it shows where the center of the storm may go, not where the damage will be. The National Hurricane Center says its cone shows the probable track of the center only and that tropical cyclone effects extend well beyond it. Second, on average the NHC official forecast has smaller errors than any individual model, because forecasters weigh all of the guidance. Use the spaghetti to see the range of possibilities, and the official forecast for decisions.
Ensemble tracks that bunch up near the coast with the same turn give more confidence about where the storm will be. Tracks that fan out, with some recurving out to sea and some crossing land, mean the forecast is waiting on the steering pattern, which you can check on a 500 mb map.
Winter storms
For a nor’easter, a few miles of track can move the rain-snow line across a city. Spread in the track therefore translates into spread in snowfall. NWS State College notes that the heaviest snow in a nor’easter falls north and west of the low’s track and that timing precipitation changes is very difficult when the track is uncertain. A plume at your location helps because it translates the track spread into the totals that matter: some members will show a foot, some a dusting, and the count tells you which is more common.
Pair a spaghetti plot of storm tracks with a plume at your location. The first shows where the storm may go. The second shows what that does to your snow or rain. Our 40/70 benchmark guide shows how forecasters use a fixed reference point for the track.
Ensembles in 4070
- Plumes: ensemble members and recent-run sets at a U.S. point for temperature, precipitation and snow, with the models grouped so you can look at one at a time.
- Storm Tracks: developing lows through the GEFS and ECMWF ensembles and the four most recent runs of several models, with agreement, spread and central pressure. The paths show model support, not a probability or impacts.
- Ensemble storm tracks for tropical systems: GEFS, ECMWF ENS and AIFS ENS member tracks and an experimental consensus. These are model runs, and the National Hurricane Center remains the official source.
- Model Explorer includes GEFS spaghetti contours, GEFS mean and spread, and ECMWF EPS mean and spread maps.
All of these are part of 4070 Pro, with a seven-day free trial. See the model pages for GEFS, ECMWF EPS and the most accurate model guide.
Ensemble spread shows model uncertainty. It is not a probability of rain, snow or damage at your address. Official National Weather Service forecasts, watches and warnings remain the authority.
Common questions
What is an ensemble forecast?
It is a set of forecasts from the same model, each started from slightly different conditions. The members show a range of possible outcomes, and the spread among them shows how confident the forecast can be.
What is a spaghetti plot?
It is a map with one line per ensemble member or per model, showing a contour or a storm track. When the lines bunch together, confidence is higher. When they fan out, the forecast is still uncertain.
What does ensemble spread mean?
Spread is how far apart the members are. Narrow spread means higher predictability, and wide spread means the forecast is less certain. It measures model uncertainty and not the chance of any specific outcome.
What is a plume in weather forecasting?
A plume plots every ensemble member’s value for one location over time, such as accumulated precipitation. The width of the plume shows how much the members disagree, and the clustering shows what is most common.
How do I read hurricane spaghetti models?
Each line is the predicted track of the storm center from one model or member. Look for clusters and splits, remember that the center is not the impact area, and use the National Hurricane Center forecast as the official reference.
Is the ensemble mean the best forecast?
Often the mean is more reliable than a single run, especially beyond about three or four days, but it smooths away features that only some members show. Read the mean together with the spread.
How many ensemble members support the run?
It is the right question to ask of any dramatic run. If only one member out of many shows it, it is an outlier. If a large share of members agree, it is a scenario worth taking seriously.
Sources
- NOAA WPC, Ensemble training. An ensemble is two or more forecasts verifying at the same time; the high-resolution control is the best member only about 5 to 7 percent of the time; the GFS ensemble mean began to beat the operational GFS for 500 mb heights at about day 3.5; a multi-model ensemble may verify better than one from a single model.
- ECMWF, Quantifying forecast uncertainty. Every forecast carries uncertainty from the starting state and from model approximations, both growing with time; ensembles estimate it.
- ECMWF, 30 years of ensemble forecasting. The atmosphere is chaotic, so no forecast system can be perfect; ensemble spread is a measure of predictability and forecast confidence.
- NOAA CPC, Ensemble spaghetti plots. CPC publishes spaghetti plots of ensemble members for days 3 to 7 and mean maps for later periods, with the ensemble mean drawn as a dashed line.
- NOAA NHC, Tropical cyclone guidance model summary. On average NHC official forecasts have smaller errors than any individual model, because forecasters weigh all of the guidance.
- NOAA NHC, About the cone graphic. The cone shows the probable track of the center only; tropical cyclone effects extend well beyond it.
- NWS State College, Snow storm types. In a nor’easter the heaviest snow falls north and west of the low’s track, a fairly consistent line between rain, mixed precipitation and snow moves along with the storm, and an uncertain track makes the timing of changes very difficult.
See the spread for your own location.
Plumes and Storm Tracks are part of 4070 Pro. Start with seven days free, then $14.95 a month.