
Guides / Plumes
Weather plumes: how to read one for your town
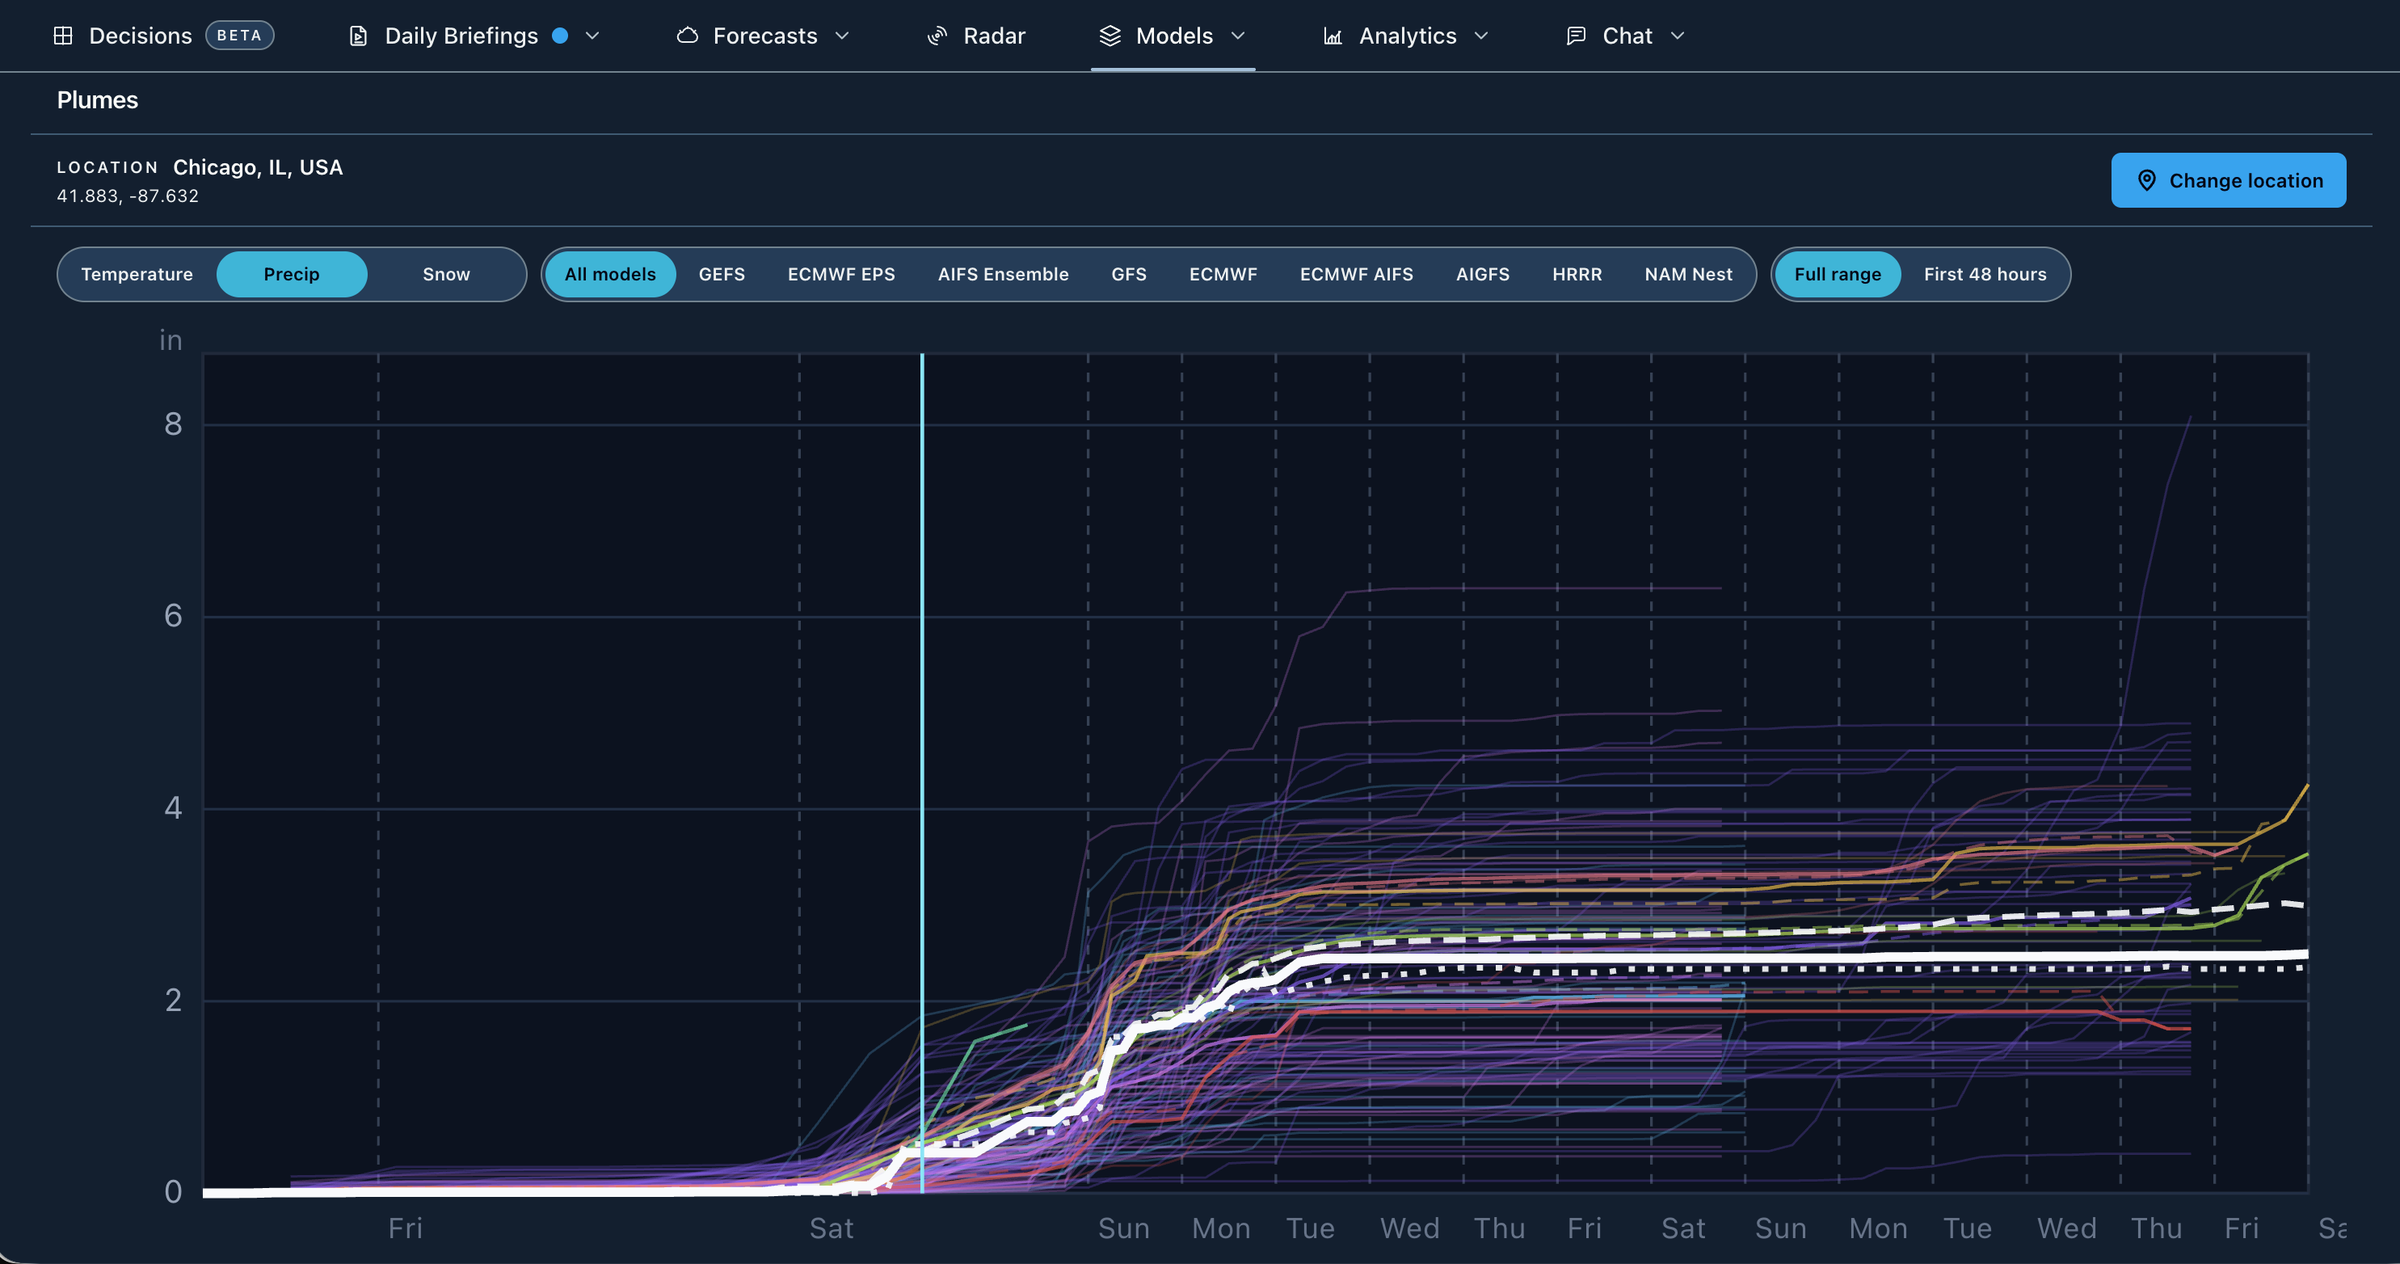
A weather plume is a chart of many forecasts for one place over time, usually every member of an ensemble or several recent runs of one model. Lines packed together mean the forecasts agree, and a wide fan means they do not. In 4070 you can put GEFS, ECMWF EPS, AIFS, GFS, Euro, AI-GFS, HRRR and RRFS plumes for a U.S. point on one chart, as part of 4070 Pro.
By Weather Decision Solutions. Published . Updated .
What a plume shows
A forecast map shows one model across a whole region at one moment. A plume flips that around. It holds the place still and shows how a variable, such as temperature or total snow, changes over the coming days in every forecast at once. Each thin line is one forecast, so you can see at a glance whether that big snow total on social media has company or is standing alone.
| What you see | What it means |
|---|---|
| Lines packed together | The forecasts agree at that time. Agreement raises confidence, though every line can still be wrong in the same way. |
| Lines fanning apart | The forecasts disagree. The further the fan opens, the less any one line deserves your trust. |
| A thick middle line | A typical value, such as the mean or median. It is a summary of the fan and not a forecast that any one run made. |
| One or two lines far from the rest | An outlier. It may be a real possibility, but few forecasts support it. |
| Two clusters with a gap | Two different outcomes, such as a storm tracking inland or offshore. An average between them can describe weather that almost no line shows. |
How to read a plume, step by step
- Check the place, the variable and the units. A plume answers for one point, and precipitation and snow lines usually add up over time.
- Find where the lines start to spread. That time is roughly where the forecast stops being settled.
- Read the middle of the fan first, then its edges. The middle is a reasonable starting point, and the edges show the range to plan around.
- Count the lines behind any big number. If two of 31 members show a foot of snow, that is a possibility worth watching and not the forecast.
- Look for clusters. Two groups usually mean two storm scenarios, and it helps to find out what separates them on a map.
- Compare two ensembles. WPC notes that a multi-model ensemble may verify better than one from a single model, so GEFS and ECMWF EPS landing in the same range is more convincing than either alone.
- Check again after the next run. A fan that keeps narrowing around the same value means more than one sharp-looking run.
How to read a snow plume
A snow plume climbs when snow is falling and goes flat when it stops, so the slope gives you timing and the top of each line gives you a storm total. The width at the end of the storm is your range of totals.
Snow takes more care than rain because a model has to turn liquid into depth. The National Weather Service office in La Crosse calls 10:1 an old rule of thumb and notes that real ratios vary widely, even within one storm. Models also handle the change between rain and snow differently, so read the precipitation plume beside the snow plume. If precipitation lines agree and snow lines do not, the argument is probably about temperature and not about the storm itself.
Remember that a point on a model grid is an average over the grid box. In the mountains or near a lake, your own spot can differ a lot from the nearest grid point, even when every line agrees.
Ensemble plumes and recent-run plumes
Plumes come in two kinds, and they answer different questions. They look alike, so check which one you are reading.
| Kind | Each line is | What it tells you |
|---|---|---|
| Ensemble plume | One member of the same forecast, started from slightly different conditions. | How far the outcomes could spread from today’s starting point. |
| Recent-run plume | One recent run of a single model, such as the last four GFS runs. | Whether the model has been holding steady or shifting from run to run. |
Recent runs are not an ensemble of equals, because the newest run started from fresher data. They are still a quick way to catch a model that keeps changing its mind.
Which models have plumes in 4070
| Model | Each line is | Lines |
|---|---|---|
| GEFS | Ensemble member | 31 |
| ECMWF EPS | Ensemble member | 50 |
| AIFS Ensemble | Ensemble member | 50 |
| GFS | Recent run | 4 |
| NOAA AI-GFS | Recent run | 4 |
| ECMWF IFS (the Euro) | Recent run | 3 |
| ECMWF AIFS | Recent run | 4 |
| HRRR | Recent hourly run | 7 |
| RRFS | Recent run | 3 |
| NOAA AI Ensemble (experimental) | Ensemble member | 31 |
| NOAA Hybrid Ensemble (experimental) | Ensemble member | 62 |
RRFS took the place of the NAM 3 km Nest in Plumes on November 3, 2026. The AI-GFS does not forecast snowfall, so it has no snow lines. The hybrid ensemble contains the GEFS members, so it is not independent of GEFS.
Where to see plumes for your town
In 4070, Plumes puts all of these models on one time chart, so two runs that started at different times still line up at the same moment.
- Open Plumes from Models, on the web or in the app.
- On the web, click the map, use a saved place, search for an address or type a latitude and longitude. In the app, change the location at the top.
- Choose Temperature, Precip or Snow.
- Use the model buttons to look at one model at a time, or leave all of them on to compare.
- Select Table to read the same forecasts as a color-coded table by day or by 3 or 6 hours.
Plumes is part of 4070 Pro, which starts with a seven-day free trial. Public agencies also publish related charts at no cost. ECMWF’s open charts include ENS meteograms, which show the European ensemble at a location as box and whisker plots. NOAA’s Model Analysis and Guidance site has GEFS maps, and NOAA’s Climate Prediction Center publishes spaghetti plots. These are useful references, though they do not put several models on one chart for your address.
Common mistakes
- Treating the highest line as the forecast. It is often the one that gets shared, and it is rarely the most likely outcome.
- Treating the middle line as a promise. WPC found that the high-resolution control is the best member only about 5 to 7 percent of the time, so no single line should be trusted just because it looks detailed.
- Assuming tight lines mean certainty. Members of one ensemble share the same model, so they can miss together.
- Reading a plume far past its useful range. Late in a forecast the fan is often a picture of how little anyone knows, which is honest and still useful.
- Forgetting the wider setup. A plume tells you how much and when at one point. It takes a map, such as a 500 mb map, to see why.
Plumes show model output, not a WDS or National Weather Service forecast. Official National Weather Service forecasts, watches and warnings remain the authority for safety decisions.
Common questions
What is a weather plume?
A weather plume is a chart of many forecasts for one place over time. Each line is one ensemble member or one recent model run, and the width of the fan shows how much the forecasts disagree.
What is the difference between a plume and a spaghetti plot?
A plume shows every forecast at one place over time. A spaghetti plot shows every forecast across a map at one time. Use the spaghetti plot to see where a storm may go and the plume to see what that means for your town.
How do you read a snow plume?
Lines climb while snow falls and go flat when it stops, so the slope gives timing and the top of each line gives a storm total. Read the middle of the fan first, then its edges, and count how many lines support any big number.
What does a wide plume mean?
It means the forecasts disagree, so confidence is lower at that time. Narrow plumes mean they agree, although every line can still be wrong together.
Where can I see GFS and ECMWF plumes for my town?
In 4070, Plumes shows GFS, GEFS, ECMWF and ECMWF EPS lines for a U.S. point on one chart, as part of 4070 Pro with a seven-day free trial. ECMWF’s open charts also publish ENS meteograms for a location at no cost.
Is a plume the same as a meteogram?
They are close relatives. A meteogram usually shows several variables over time at one place, often for one forecast or as a summary such as a box and whisker plot. A plume shows one variable with a line for every forecast.
Sources
- NOAA WPC, Ensemble training. An ensemble is two or more forecasts verifying at the same time; the high-resolution control is the best member only about 5 to 7 percent of the time; the GFS ensemble mean began to beat the operational GFS for 500 mb heights at about day 3.5; a multi-model ensemble may verify better than one from a single model.
- ECMWF, Quantifying forecast uncertainty. Every forecast carries uncertainty from the starting state and from model approximations, both growing with time; ensembles estimate it.
- ECMWF, ENS meteograms (open charts). Point-based charts that show the ENS forecasts for a location as box and whisker plots.
- NOAA NCEP, Model Analysis and Guidance. NOAA’s public model map site, including GEFS maps.
- NOAA CPC, Ensemble spaghetti plots. CPC publishes spaghetti plots of ensemble members for days 3 to 7 and mean maps for later periods, with the ensemble mean drawn as a dashed line.
- NWS La Crosse, Why snow ratios matter. 10:1 is an old rule of thumb; real snow-to-liquid ratios vary widely, even within one storm, with temperature, cloud makeup and wind among the reasons.
- NOAA WPC, Snow-to-liquid ratio training slide. Warm air near the ground or near-freezing layers keep ratios down; deep cold raises them.
- NWS Service Change Notice 26-47, retire NAM, SREF, HREF and HiresW. As updated October 2, 2026: the NAM 12 km and its nests, SREF, HREF, HiresW and NAM MOS end November 3, 2026 at 1200 UTC, or the next suitable weekday if significant weather is expected.
- NWS Service Change Notice 26-48, RRFS and REFS implementation. As updated October 15, 2026: RRFS, the 3 km replacement, and REFS, the replacement ensemble, start November 3, 2026, the same day the legacy models end.
See the plumes for your town.
Plumes is part of 4070 Pro. Start with seven days free, then $14.95 a month.